
Analytics Dashboard Templates

Orion UI kit
Figma library with 40+ full-width charts templates served in light & dark themes. Contains 200+ of dataviz widgets that look perfect on desktop & mobile screens.

Nocra UI kit
Nocra is a design system for AI products. Built specifically for startups harnessing AI generation: images, video, audio, music, prompts, and beyond.

Figma Charts UI kit
Components-driven graphs design kit for dashboards, presentations, infographics & data visualisation. Includes 25+ charts types for all the viewports.

Nucleus UI
Nucleus UI contains 1000 components and variants with 500+ mobile screens designed for Figma (including 9 themes from Event, E-commerce, Finance, NFT, etc.).
.webp&w=1920&q=75)
Material X for Figma
Figma library with 1100+ components & 40 app templates beyond Material Design. Powered by top-notch shapes and Manrope font. Customizable & Adjustable UI kit now available for Angular & Figma
.webp&w=1920&q=75)
Material You UI kit
Figma & React library with 2600+ variants of 32 components compatible with Material Design 3. Plus 220+ dashboard templates for all the viewports. Now available for NextJS & TailwindCSS.

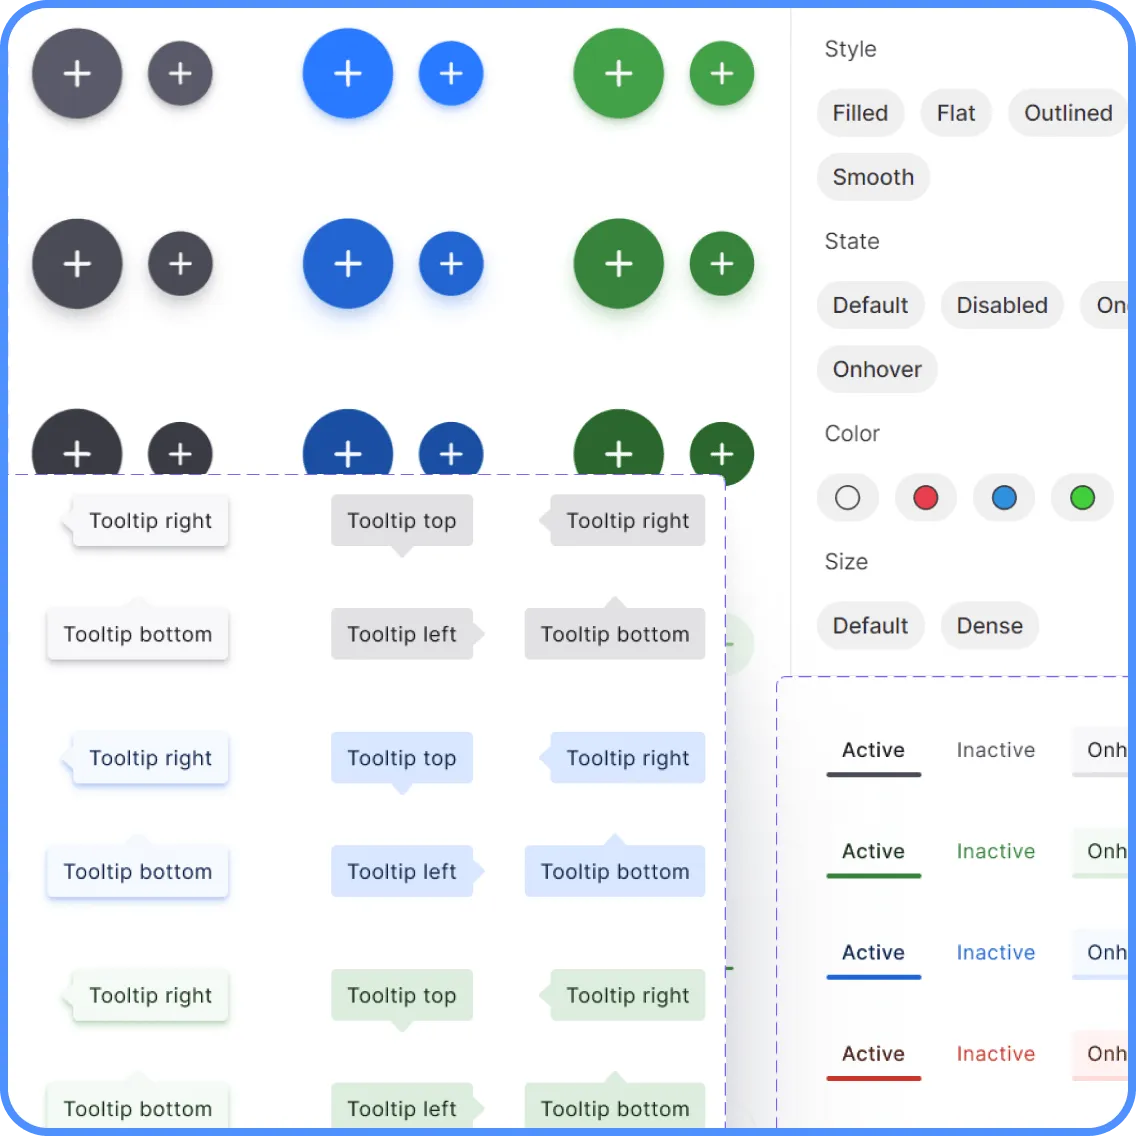
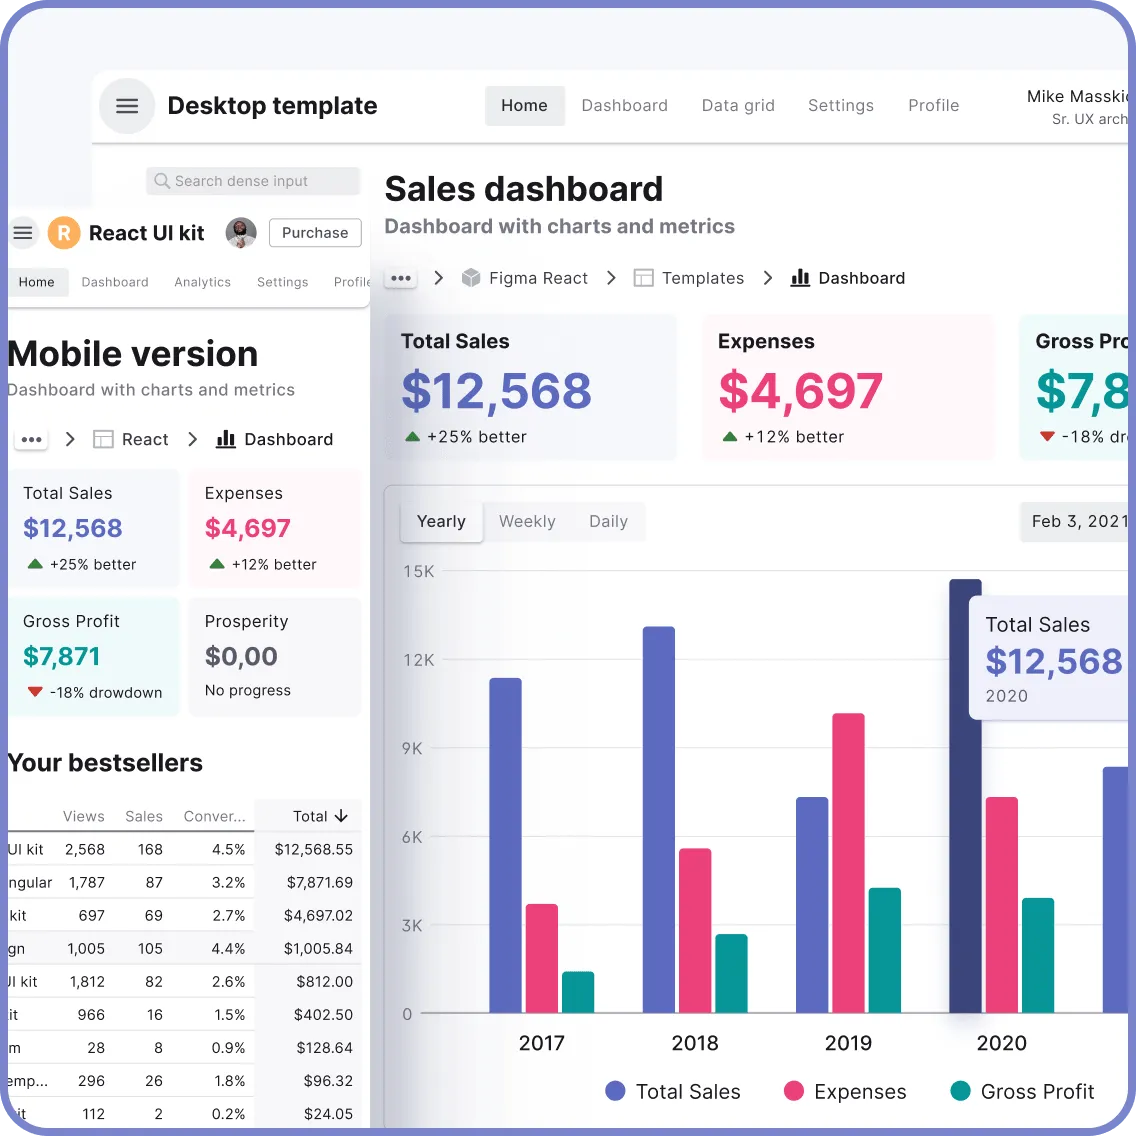
Figma React UI kit
Designed and well-organized in Figma React-based UI toolkit for the web. Optimized for building complex data-dense interfaces for desktop and mobile applications.
.webp&w=1920&q=75)
Panda Design System
Figma library with dashboard, calendar, kanban, profile, table, ecommerce and 80+ templates in total. Components with variants, dark theme included.
What is an Analytics Dashboard?
The analytics dashboard is used by a user to aggregate and display key metrics and data points from the multiple channels in one view. It aims at quick and actionable insights, allowing companies to base decisions on data. Utilizing an analytics dashboard teams can track such important metrics as conversion rates, bounce rates and traffic sources in real-time.
Benefits of Using Analytics Dashboard Templates
Our analytics dashboard templates offer several benefits in using them:
- Powered by the intelligent auto layout, variants and styles, our templates are part of a comprehensive design system.
- Preview Variants of Components & UI Widgets makes dragging and dropping easy as can be.
- Scalable Layouts whatever Viewport: Our kits are made to be used with ease in any viewport.
Dark and Light Versions are both included: Our clean and modern dashboard UI kits include high-quality full-width desktop templates that cater to different tastes in design.
Get Started with Our Analytics Dashboard Templates ✊
FAQs
What is an Analytics Dashboard Template?
An analytics dashboard template is a pre-designed layout that arranges and represents your data in an visually and readily digestible format. The purpose of these templates is to make it easier for a new dashboard to be configured which assures that all of the most important metrics and KPIs are clearly displayed. These templates let you follow performance over many channels including in terms of web traffic, email efforts, and social media sharing.
Why use an Analytics Dashboard?
An analytics dashboard can be used to compile data from a variety of sources into one coherent view. It helps companies monitor the key metrics and make wise decisions, because it offers insight into user behavior, traffic sources, campaign performance, and other crucial areas for long-term success. This tool is needed to keep track of progress toward business goals and business goals, so that adjustments can be made in a timely fashion and strategies optimized.
What are the Benefits of Analytics Dashboards?
Analytics dashboards offer numerous benefits, including:
- Real-Time Data Monitoring: Keep track of your data as it updates in real time. This way you can stay on top of trends and changes.
- Centralized Data: Bring data from different sources including Google Analytics dashboards, Facebook and Google Ads together under one roof.
- More Rational Decision-Making: Obtain powerful insights that allow for better company decisions and other future directions.
- Time Efficiency: Cut down on the time spent in gathering and visualizing data by letting automation take over some of these jobs.
- An Essential Dynamic: Let your team share its
How to Choose the Right Dashboard Template?
There are several criteria to consider when choosing the right analytics dashboard template:
- Purpose: What are your goals? Which Key Performance Indicators (KPI) do you need to track? A digital marketing dashboard could look to such statistics as click-through rate and conversion rate.
- Customization: See that the template is easy to customize so it will fit your needs specifically.
- Compatibility: Check if the template wraps your data sources and tools and fits into them seamlessly.
- Design and Usability: Look for templates that are easy to understand and visually appealing. That makes communicating information more efficient because everyone can recognize the same icons, colors (and now fonts).
- Scalability: Choose templates that can grow with you as your business grows.
- By considering these factors, you can choose a most suitable template that will take care of your tracking and analysis needs much more effectively.
Can I also build commercial products with your products?
That's right. Our Figma analytics dashboard templates are unrestricted in how many commercial projects they may be used for. However, it is your own responsibility to determine which type of license is suitable to your needs. We provide both business and personal licenses to cater to different audience demands. And if you require a more bespoke answer, we are happy to custom make it for you. Please get in touch with your case specifics, financial approach and hopes.
I’m New to Figma. Should I Try Your Kits?
Certainly! Our items are suitable for everyone, beginners included. If you study our Commercial UI kits meticulously, you’ll see how components and layouts are built; which rules are applied, and some interesting tricks from other stylists. It's not difficult to bring our kits into Figma. We also have all the guidance you need in our instructions.
I Love Your Designs, But Can I Have a Discount?
We're so glad you like our design products! We do plan to reward customers who get in touch with us using a line or two of their own thoughts about our goods. Simply send us a message stating the product you want and we will furnish an exclusive discount code for you.
Try one of our analytics dashboard templates and start turning your data into insights you can act on. Get in touch with us to discuss your project or place an order. Now, let's start building greatness together, right!?

