
Finance Dashboard Templates

Orion UI kit
Figma library with 40+ full-width charts templates served in light & dark themes. Contains 200+ of dataviz widgets that look perfect on desktop & mobile screens.

Nocra UI kit
Nocra is a design system for AI products. Built specifically for startups harnessing AI generation: images, video, audio, music, prompts, and beyond.

Figma Charts UI kit
Components-driven graphs design kit for dashboards, presentations, infographics & data visualisation. Includes 25+ charts types for all the viewports.

Nucleus UI
Nucleus UI contains 1000 components and variants with 500+ mobile screens designed for Figma (including 9 themes from Event, E-commerce, Finance, NFT, etc.).
.webp&w=1920&q=75)
Material X for Figma
Figma library with 1100+ components & 40 app templates beyond Material Design. Powered by top-notch shapes and Manrope font. Customizable & Adjustable UI kit now available for Angular & Figma
.webp&w=1920&q=75)
Material You UI kit
Figma & React library with 2600+ variants of 32 components compatible with Material Design 3. Plus 220+ dashboard templates for all the viewports. Now available for NextJS & TailwindCSS.

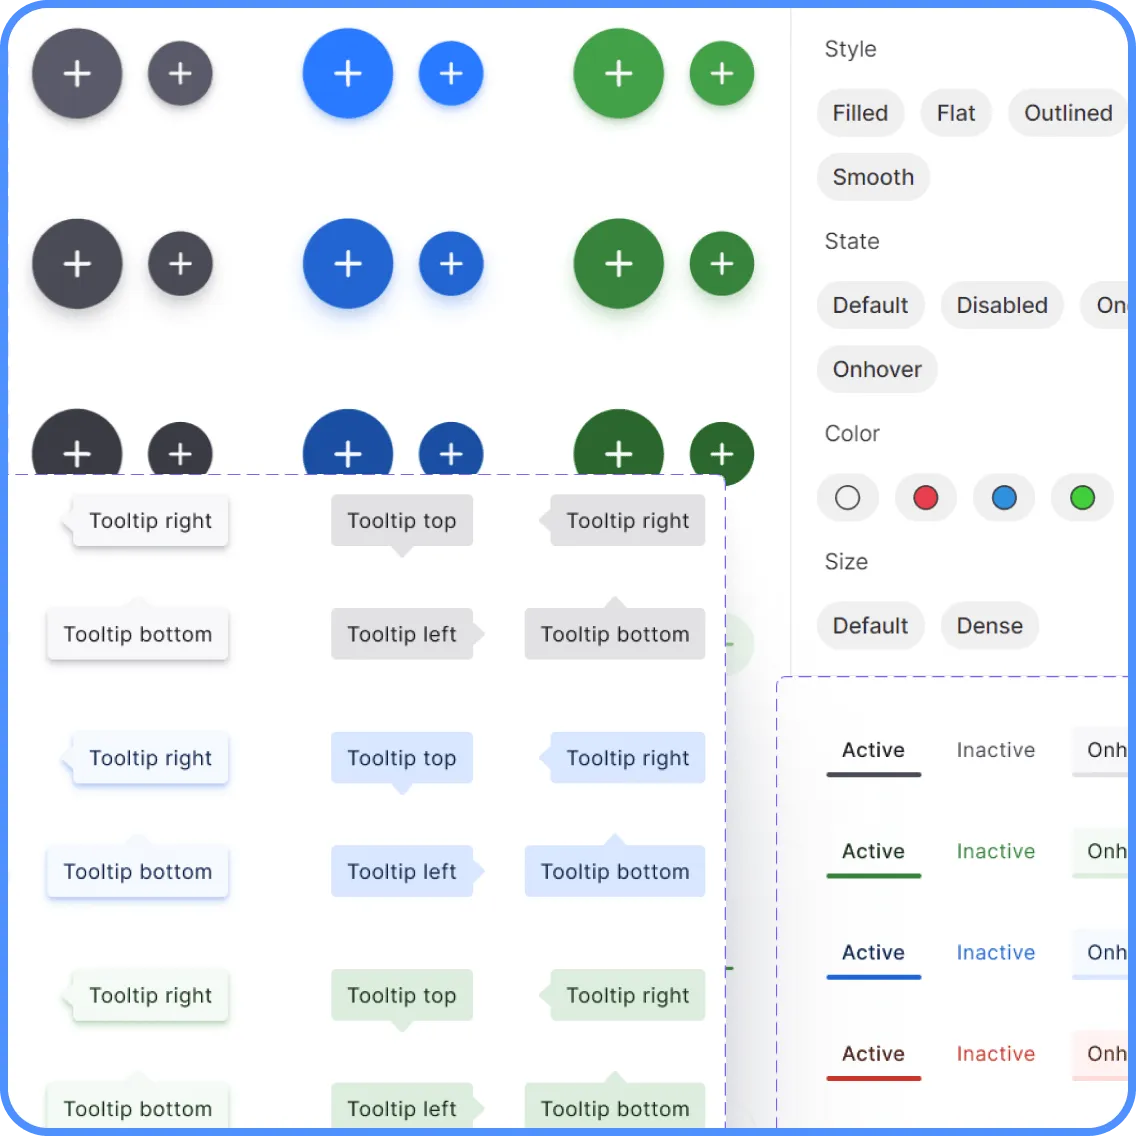
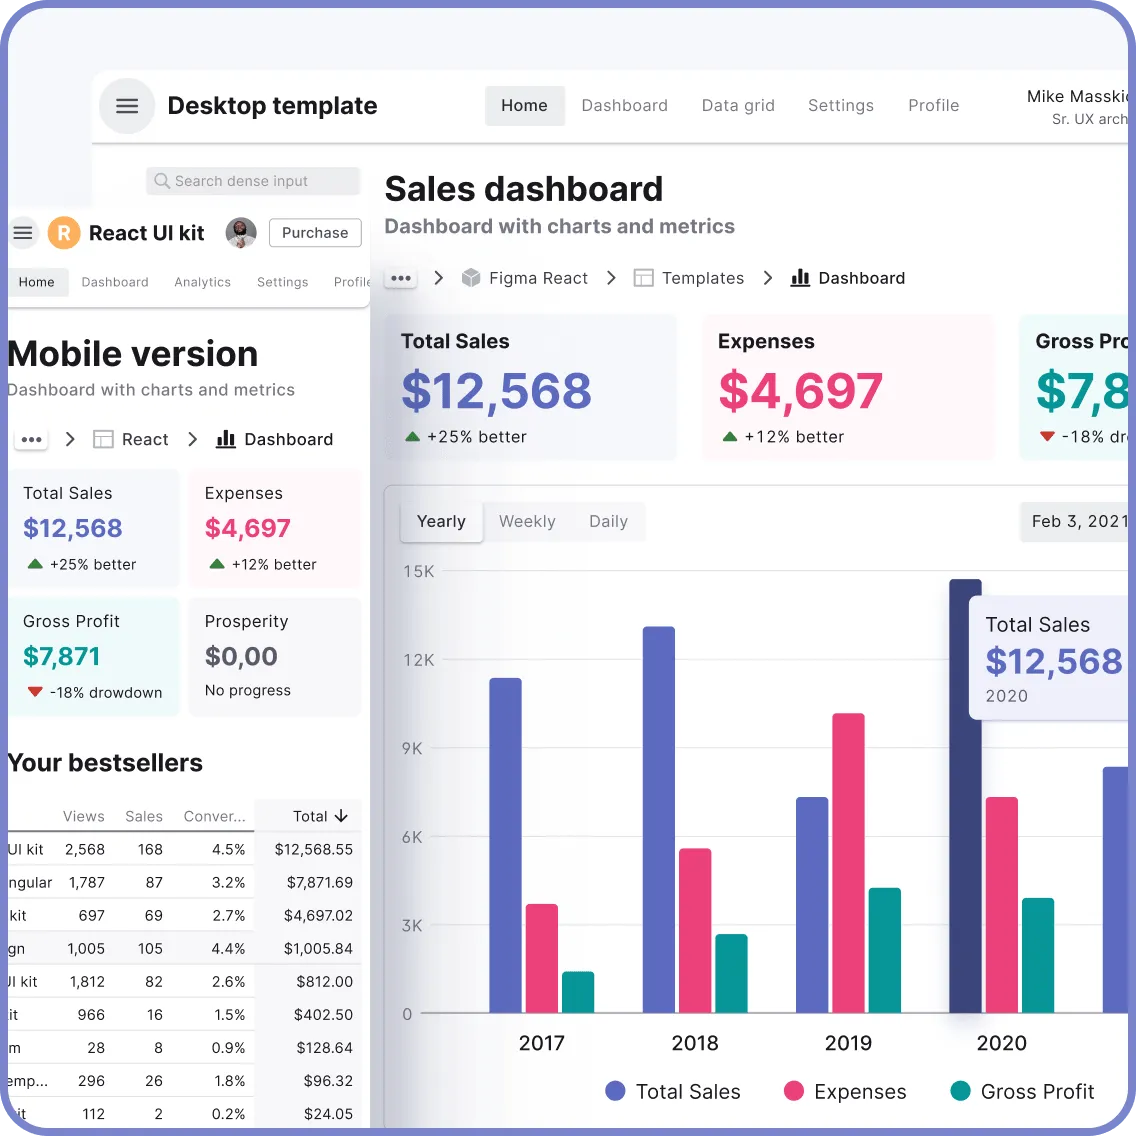
Figma React UI kit
Designed and well-organized in Figma React-based UI toolkit for the web. Optimized for building complex data-dense interfaces for desktop and mobile applications.
.webp&w=1920&q=75)
Panda Design System
Figma library with dashboard, calendar, kanban, profile, table, ecommerce and 80+ templates in total. Components with variants, dark theme included.
What is a Financial Dashboard?
A financial dashboard is a picture of financial information essential. With it, you can see at a glance how much money has been spent and earned for your company: expenses, sales numbers, even profits. Financial dashboards transform complex financial data into simple visual forms like charts, graphs and even widgets.
How Can Financial Dashboards Help Make Business Decisions?
By utilizing financial dashboards, you can easily access key metrics like revenue, costs, profit, and other important indicators. Here are some ways in which they can help your company:
- Data That's Always Up-to-Date: Financial dashboards provide real-time access to financial data, eliminating the need for manual data collection and repetitive work. With current information, trends can be spotted just as soon as they arise so decisions impacting your bottom line are made easier and more accurately than ever before.
- Track Performance in Real-Time: With a financial dashboard, companies can trace various performance metrics at any time they like. Everything from revenue and costs to profits and cash flow is laid bare before the decision maker's eyes so that many different aspects of the organization's financial performance come under scrutiny - and by doing all in one place, if so required.
- Trend Identification: Financial dashboards allow you to track the trends and patterns of your financial data. By analyzing historical financial information, then giving its history some thought, occasionally you will spot certain things that are unforeseen and could help predict future trends in the market or avoid potential challenges.
- Goal Tracking: Financial dashboards enable organizations to set specific goals and monitor progress. Activities can be quantified in detail, so that for every target you devise with an eye on your budget, you will know how much was done and what remains to be carried out.
Finance Dashboard Templates Benefits
Finance dashboard templates from us have many advantages which can boost your financial presentation:
- An Organized Library that Saves You Time: With auto-layout power integrated variants, color, and text styles as a design system at once helpful for coders who want to take control over basic elements!
- Preview Variations in Components and UI Widgets: Auto-layout drag & drop components are accurately made, with variants supporting the interface incorporated and ready-made blocks achievable. A
- Easy to Change Components: With its sections and substyle, auto-layout has been designed to facilitate rapid exchange in the event of changes in your business environment.
- Scalable Layouts for Any Viewport: Designed for scalability, meaning it works just as well on your smartphone or tablet screen because of the use of auto -layout techniques regardless what device you are running.
- Dark/Light Dashboard Templates: A kit included with high-quality desktop templates that can be stretched to fit the entire screen. Modern dashboard UI is clean and stylish.

Get Started with Finance Dashboard Templates Today!✊
FAQs
What Are Finance Templates?
Finance templates are a kind of material which helps visualize financial data for sharing. They usually come with key metrics, charts and tables to allow finance professionals or decision makers know how well their money is being used (performance).
How to Use Finance Templates?
You have to go through the following procedures if you want to use finance templates:
- Select a Template: Pick a template that meets your project requirements.
- Install Dependencies: Make sure all necessary dependencies have been installed, including data sources and libraries if they are needed.
- Import Template: Bring the template into your project, either by coping over relevant files or using package managers.
- Customize: Refit the template to suit your particular needs through amendments to styles, the addition of extra components, and by adjusting layout structures.
- Deploy: After appropriation, integrate templates into the app and realize their operation.
What Are the Types of Templates in Finance?
To suit different financial reporting requirements, there are various types of finance templates.
- Financial Reporting Dashboard: Offers a quick view of how well the company is doing with revenues, costs and profit margins.
- Cash Flow Dashboard: Is used to monitor cash inflows and outflows so that liquidity can be better managed in light of the business circumstances.
- Sales Performance Dashboard: In addition to sales statistics, customer data and revenue trends are monitored in real time using this method.
- Management Dashboard: Concentrated on the key performance indicators that management needs to know and make informed decisions about.
What are the advantages of using financial performance dashboard templates?
Advantages of financial dashboard templates include:
- Improved Efficiency: templates come with pre-designed layouts and components you can use to build finance dashboards.
- Consistency: Templates ensure that different dashboards will look the same which helps maintain a very professional feel.
- Customizability: Templates can be easily tailored to meet your specific business needs and preferences. In addition, they are quite simple when you're trying hard not to mess them up.
- Real-Time Data: Many templates are designed to integrate with real time data sources providing up to date insights and analysis.
- Actionable Insights: By offering finances simple visualization in clear language, they help users to think and decide.

