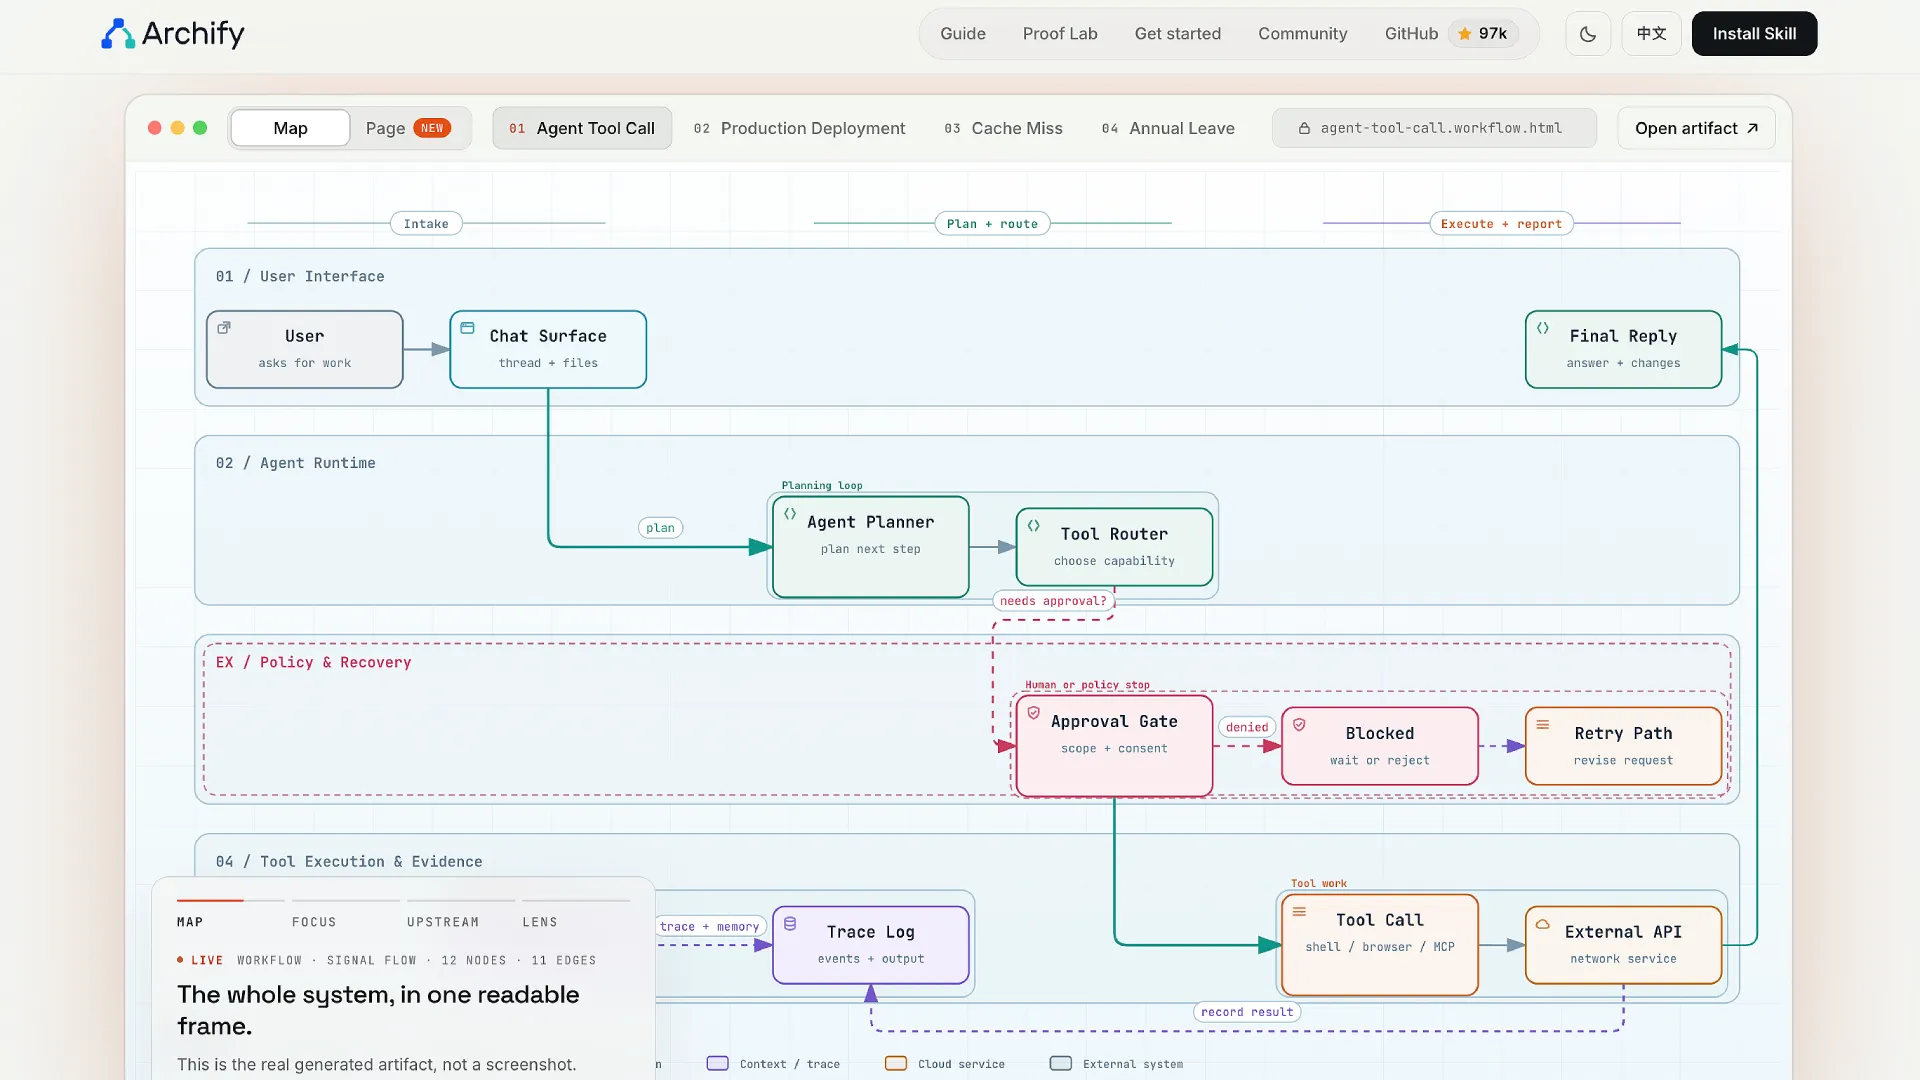
You need a diagram. You open a drawing tool, drop boxes on a canvas, connect them with arrows, and keep nudging alignment until the picture stops looking accidental. Then someone asks what happens when the cache misses, and the layout work starts again. Archify takes the drawing out of the job. You describe the system to your coding agent in one sentence, and it returns an interactive HTML page you can click through.
What Archify actually does
Archify is a skill you add to an AI coding agent rather than a separate app you open. It installs into Cursor, Claude Code, Codex CLI, or OpenCode, then behaves like one more capability the agent already has. Ask for a diagram of a request path, and the agent writes the structure, Archify renders it, and you get one self-contained HTML file back. There is nothing to sign up for.
The install is one line you paste into the agent:
npx -y skills@latest add https://archify.si --skill archify --agent cursor --global --copy --yes
Swap cursor for codex, claude-code, or opencode and the same command covers the other targets. If you would rather not install anything, npx skills use tt-a1i/archify@archify runs it once.
The output behaves like a page a reader can explore. Nodes respond to a click, a path can be highlighted end to end, and a shareable link can carry the view you were looking at. The same file holds light and dark themes and exports to PNG, WebP or JPG, and prints to PDF when a deck needs a still image. Motion inside the viewer follows the reduced-motion rule in WCAG 2.2, so a diagram does not animate at a reader who asked it to stop.
Why the diagram lives in the chat now
Diagrams rot for one reason. The canvas and the code sit in different places, so the canvas never hears about the change. Someone ships a queue, the picture keeps its old arrow, and a month later nobody trusts the picture. Hand-drawn architecture ends up as a screenshot in a doc, and the doc slowly becomes decoration.
Archify puts the source next to the work. The diagram is typed JSON that lives in the repository, so a change request is a short chat message: add Redis, move auth to the left, highlight the rollback path. The agent edits the source, the renderer rebuilds the page, and the picture stays within one message of the truth instead of one quarter behind it.
☞ A diagram that takes an hour to redraw gets redrawn never. Keep the source in the repo and let the agent rebuild it.
How it works under the hood
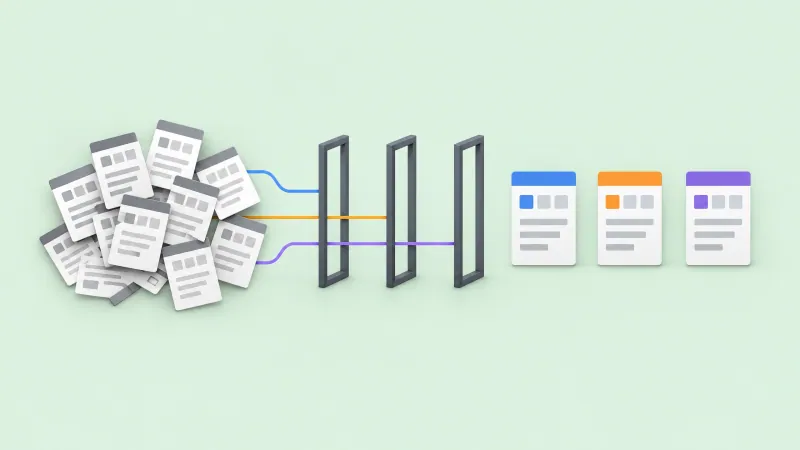
Four steps run each time, and the fourth is the one that saves you from shipping a broken picture.
- ❶ Generate. The agent writes a typed JSON source from your description or from a repository it just read.
- ❷ Validate. Bundled validators check the schema, the layout, the routes, and the clearance between labels and arrows.
- ❸ Preview. An optional loopback preview watches one source file and reloads only revisions that passed every gate.
- ❹ Deliver. A candidate is rendered in place and checked again. Only a passing artifact replaces the last good file.
Step two is where the tool differs from a prompting trick. When validation fails, you do not get a stack trace or a vague retry. You get a machine-readable receipt with a rule code, the exact subject that failed, and the repairs the tool supports, so the agent can fix the one thing that broke instead of regenerating the whole page and hoping.
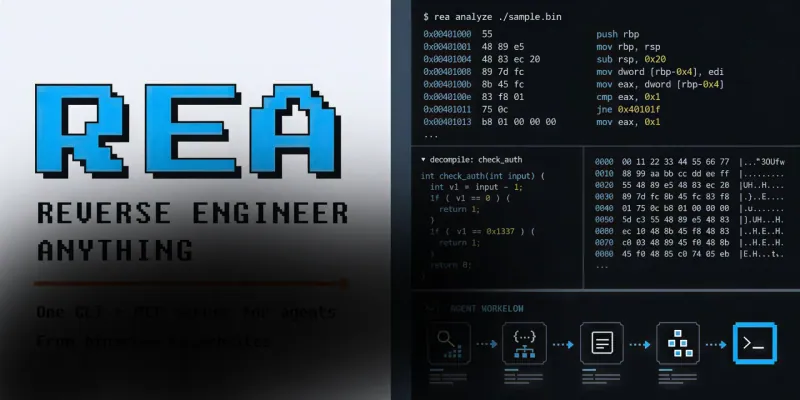
For a repository-backed diagram the nodes carry source references: each one marks itself with a numbered marker and opens the file and line range, pinned to one commit. The Evidence story is honest about its limits, because Archify reads a snapshot rather than live infrastructure. If you want the more aggressive version of that idea, the REA reverse engineering server takes a similar local-first stance for compiled and packaged apps.
Ten diagram types, one output file
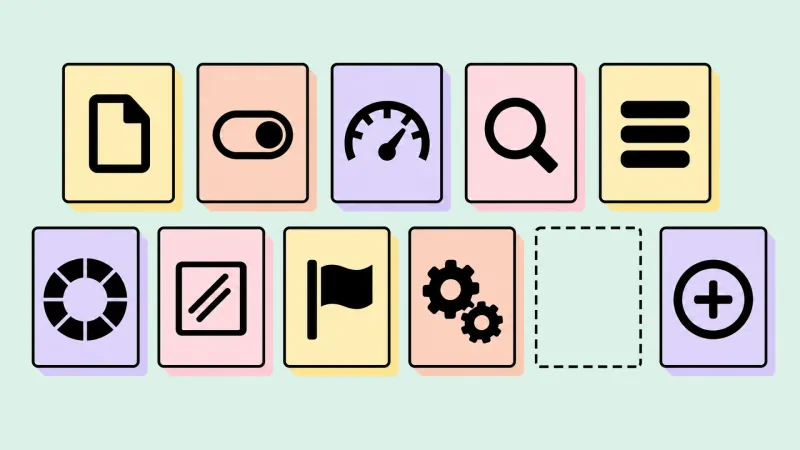
Picking the wrong shape is the most common reason a diagram fails to explain anything, so Archify ships ten checked shapes instead of one generic canvas.
- Architecture maps components, storage and trust boundaries
- Workflow maps CI/CD, approvals and runbooks
- Sequence shows one interaction over time
- Data flow shows a pipeline and where sensitive data crosses a boundary
- Lifecycle shows states, retries and terminal outcomes
- ERD holds tables, columns, keys and cardinality
- Class shows types and what implements what
- Tree shows single-parent hierarchies such as modules
- Timeline lays out an incident review or a release history
- Waterfall shows where the time went in one request
The project keeps eleven checked scenarios on its own site, with their JSON sources and validation receipts, and you can open any of them while you decide which shape fits. The gallery of those examples lives on the Archify project site, which also holds the installation guide and the scenario chooser.
Use cases
For a founder
- → A seed deck needs one honest picture of how a payment moves, so the sequence diagram shows call order, the retry branch, and the point where a webhook can arrive twice.
- → A contractor joins for six weeks. The same map replaces the walkthrough call, and the first pull request lands on day two instead of day five.
- → A customer asks why an invoice is late. A timeline of that one request answers the question faster than a paragraph of support text would.
For a designer
- → Screens you hand over show states, not the order they arrive in. A lifecycle diagram puts empty, loading, error, and retry on one page so the developer stops guessing.
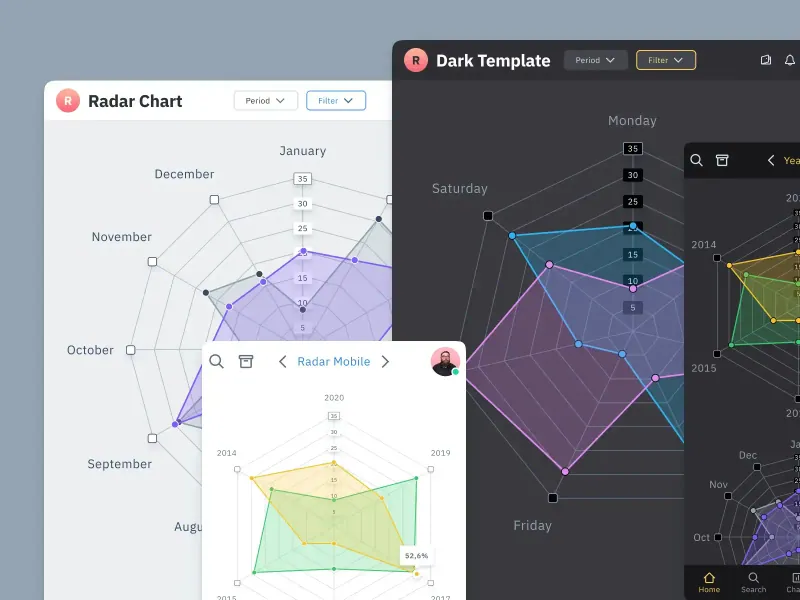
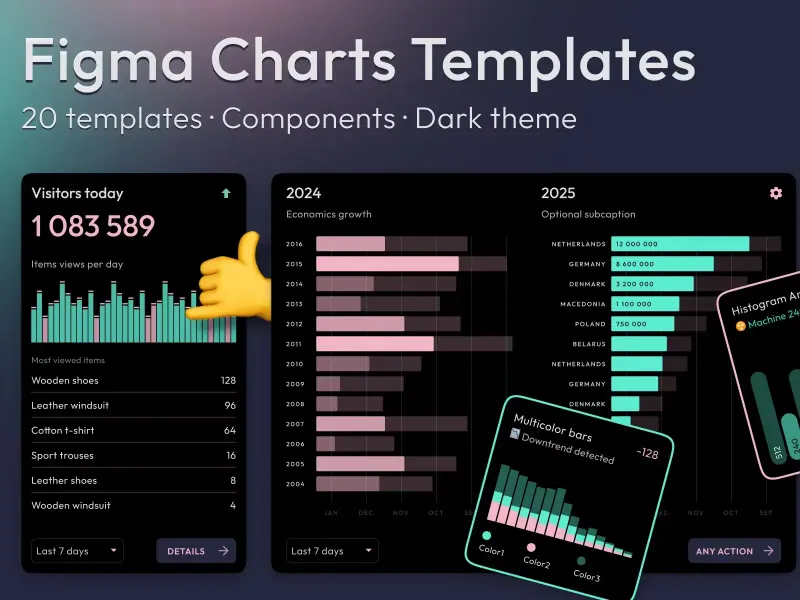
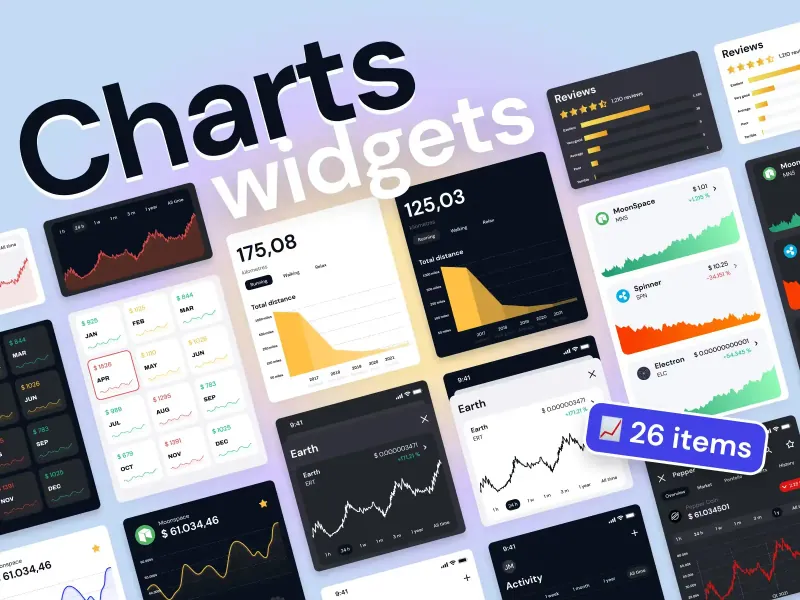
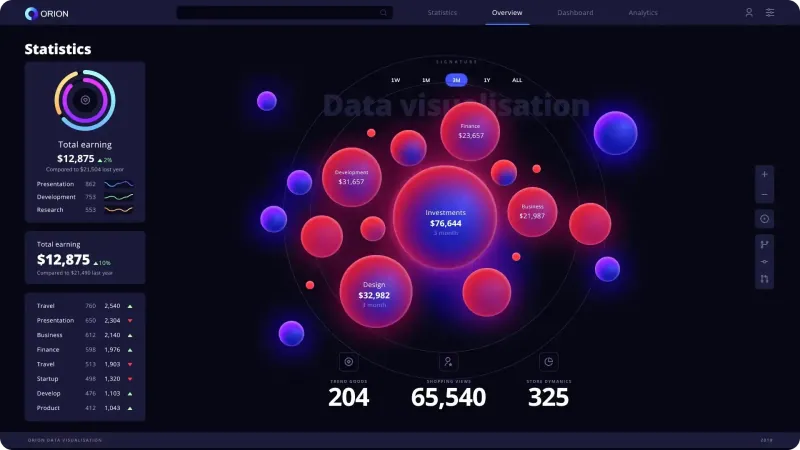
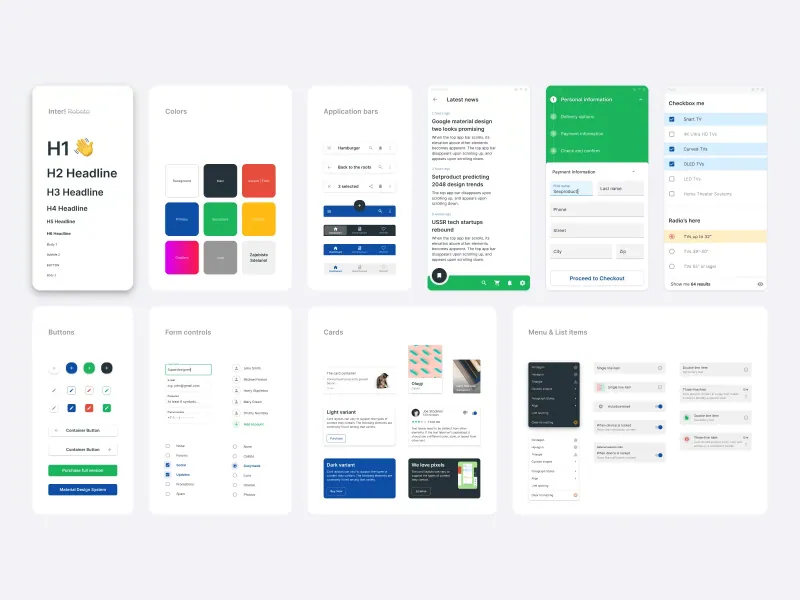
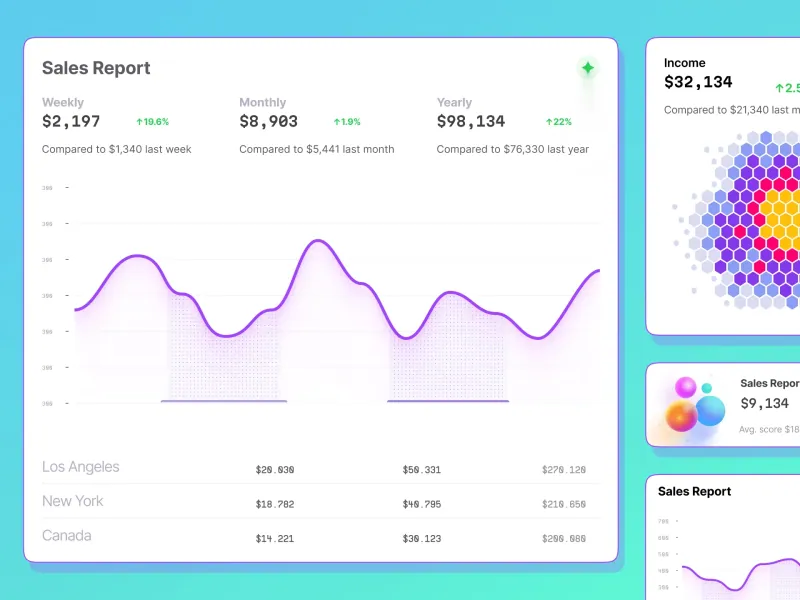
- → Before you adopt an unfamiliar UI kit, an architecture diagram of its component layers tells you what you are buying faster than the pricing page does. Our own Orion charts kit is the exercise in miniature: eight widget groups, and one diagram explains how they feed a dashboard.
- → On a client call about checkout, a sequence diagram makes the edge cases concrete enough to settle the argument in the room rather than in a follow-up email.
For a coder
- → On day one in an unfamiliar repository, ask for a runtime map of eight to twelve components and skip the week you would spend reading entry points.
- → A pull request touches three services. A workflow diagram of the changed path makes your review comment obvious to a reviewer who has never opened those files.
- → After an incident, a waterfall view of one slow request shows where the seconds went, so the postmortem stops arguing about which service to blame.
Frequently asked questions
Do I need a repository to start?
No. A text description is enough for the first diagram, which is the fastest way to check whether the shape you have in mind matches the system. Point it at a repository only when you want the nodes to carry source references.
Which agents does it install into?
Cursor, Claude Code, Codex CLI, and OpenCode are the documented targets, with an agent switcher on the project site that prints the exact install command for the one you use. Two community integrations also exist and both are labelled unofficial.
What happens when the generated diagram is wrong?
You say what is wrong. The source is typed JSON, so a change is local: one node, one edge, one label. Validation runs again before the file is replaced, and a rejection leaves your previous working diagram untouched.
Is the output really one file?
Yes. The result is a single self-contained HTML page with no server behind it, which is why it survives being emailed, committed, or dropped into a documentation folder years later.
Why it belongs in your stack
You already pay for a drawing tool that you open four times a year. The difference here is that the picture gets produced in the same minute as the question, inside the chat where the code is already open. Apache 2.0 means you can fork it, and the typed source means your team can review a diagram change like any other diff.
Start with the one path that people keep asking you to explain, which is usually checkout, login, or deployment. Then read how design handoff works with AI agents and the comparison of agent skills designers actually use. If you are still choosing your agent, the interface patterns for agent products cover what the chat side should look like. When the screens inside those diagrams need a faster start, the other free open source resources and design and code kits follow the same ship-it-yourself workflow.